Q4 2023: Investment Grade Private Credit update
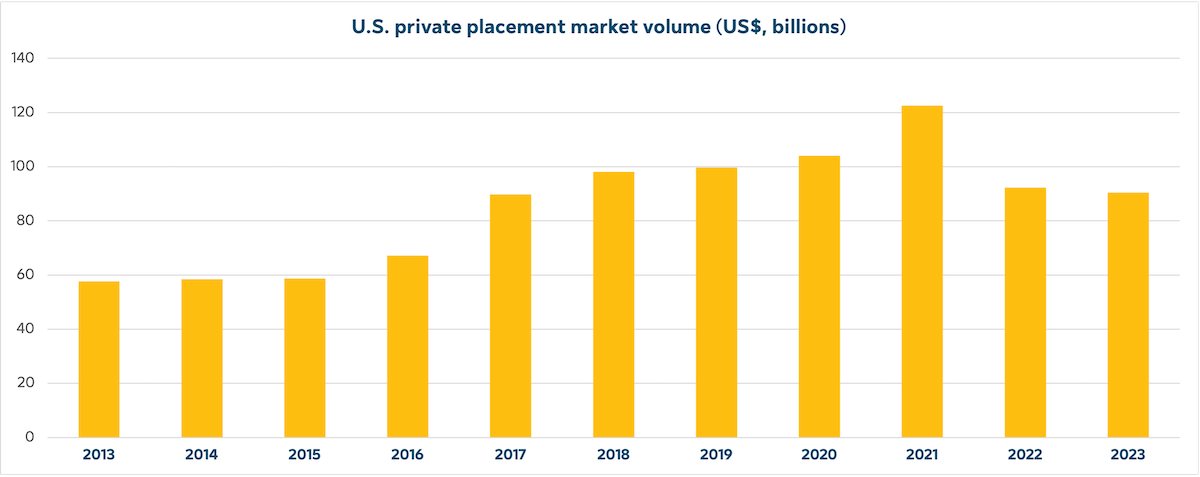
Investment grade (IG) private credit volume in Q4 2023 was the strongest for the year at US$28.6 billion, bouncing back from US$14.1 billion in Q3 2023, the lowest quarterly volume of the year. While we won’t know final results for a few months, preliminary 2023 volume of US$90.7 billion fell short of US$92.3 billion in 2022. Issuers that had something to get done came to market in the last quarter and investors responded positively. This was in contrast to much of 2023 when issuers were put off by high rates or market uncertainty and investors were either less liquid or more cautious immediately after the failure of Silicon Valley Bank.
Market statistics for the private placement market sourced from Private Placement Monitor, a standard proxy for the IG private credit market.
While volumes rebounded in Q4, certain themes persisted throughout the year - notably strong industrial and utility issuance, weaker financial sector issuance, shorter tenors and large deals. Q4 had four US$1 billion dollar issuances capping off one of the most active years for large deals. All four US$1 billion deals were by European issuers as cross border borrowers accounted for more than one-half of total issuance in Q4, something we have not seen since prior to the pandemic. The number of issuances was down significantly year-over-year while the average deal size increased significantly. Also, delayed fundings - one of the attractive features of the IG private credit market - dropped significantly from 2022 to 2023, an indication that issuers expected more stable or even lower rates.
Market
Corporate credit: Temporary periods of thin investor demand can lead to the emergence of well-priced opportunities – this is oftentimes true in December as investors wrap up budgets and head to the sidelines. While this year we did not see a noticeable “December premium,” IG private credit pricing lagged the public market for much of the year, resulting in attractive relative value.
In terms of commercial real estate, the market continues to experience unprecedented challenges due to the rise in interest rates and economic uncertainty that have dampened transaction volumes and lending activity. Whilst the current interest rate environment is comparatively favorable when viewed through a long enough historical lens, lending underwriting standards remain conservative amid downward pressure on property valuations and the notion that cost of capital is significantly higher than in-place rates on maturing debt. The result is a growing need for a “cash-in” refinancing to satisfy current underwritten requirements.
Infrastructure debt: Themes in 2023 continued to center around the rising prominence of digital infrastructure and the strong demand for renewable energy. Investment in digital infrastructure is rapidly increasing with the growth in data center development, driven by exponential growth in data consumption and continued cloud migration. Fiber optic networks and wireless communication infrastructure are also seen as expanding areas within the digital sector, as telecommunications providers optimize balance sheets through the sale of high value infrastructure assets to fund future capital expenditures. We expect that the essential nature of digital infrastructure, its strong credit characteristics and its growth trajectory will continue to drive investment and financings. Turning to the second theme of renewable power generation, this space has attracted significant investor attention, thus making it challenging to find adequate relative value. As a result, we are expecting to see better value in the energy infrastructure space in fuel storage, pipelines and liquefied natural gas (LNG) opportunities over the near term.
The area of social infrastructure is also presenting opportunities. Inflation and higher interest rates added delays to the procurement process in 2023 as government sponsors needed time to reassess budgets. We are starting to see some procurement activity resume with projects launching in both the U.S. and Canada in the first half of 2024.
Structured credit: Meaningful activity in 2023 presented some IG fixed rate opportunities. The asset-backed security (ABS) market was busy through the balance of 2023. General spread tightening in Q4 2023 across all ABS segments drove increased selectivity when considering new investments. ABS spread tightening was most pronounced in the unsecured consumer loans and marketplace lending segments, as spreads for those asset types continued to tighten from the relatively high levels experienced in Q4 2022. We expect that the compression in U.S. Treasury yields over the fourth quarter and relative stabilizing in ABS spreads has brought and should continue to bring new ABS issuers to market. The 2024 calendar year looks promising with a number of private ABS opportunities coming to market.
Primary borrower demand and secondary opportunities driven by capital constraints amongst banks resulted in robust deal flow in Q4, fairly consistent with the rest of 2023. In general, spreads across the fund finance market have remained stable with minor variations in select periods of the year and across the various sub-segments. More specifically, in Q4: (i) subscription facilities continued to price wider relative to the first half of the year; (ii) lender finance transactions experienced some minor spread tightening mirroring the collateralized loan obligation (CLO) market; and (iii) spreads in the net asset value (NAV) segment experienced some pressure as new lenders continue to enter the market.
In general, we believe investors are continuing to hunt for diversification, away from the large amount of financial and real estate investment trust (REIT) issuance over the past few years. Despite consistent market volumes, there also continues to be a mismatch as investors are focused on longer duration while issuers are seeking to borrow at shorter durations due to expectations that rates will come down over the next few years. Maturities of seven years or less as a percentage of total issuance has increased materially since rates started to rise in 2022.
Outlook
We are expecting a busy start to 2024 with many deals launching in the first few weeks in advance of the industry’s annual conference the first week in February, with more to come, supported by several corporate and infrastructure financings that were deferred into the new year. We hear from industry participants as we enter 2024 that the market is constructive and the possibility of stable or lower rates later this year could drive issuance. We expect more “normal” demand this year, resulting in tighter pricing and tougher allocations in syndicated deals. While we continue to see increased competition from new investors attracted to opportunities in IG private credit, we also see potentially increased activity from any market uncertainty. In this environment, we believe there may be increased opportunities among more bespoke, less competitive transactions that can arise from a given manager’s expertise and industry relationships.
In Focus: Why institutional investors are taking a closer look at IG private credit today
With base rates still elevated, possible cuts on the horizon and geopolitical angst as half of the global economy goes to the polls in 2024, many institutional investors are looking to harvest yields and benefit from capital appreciation while minimizing risk. IG private credit has become an increasingly popular investment option for this market in recent years, with several characteristics that can be favorable against the current backdrop.
That stated, investors need to remain mindful of certain risks present in fixed income investing overall as well as ones more specific to IG private credit. These include customary fixed income investment risks such as credit, issuer and interest rate risk.
Enhanced yield potential
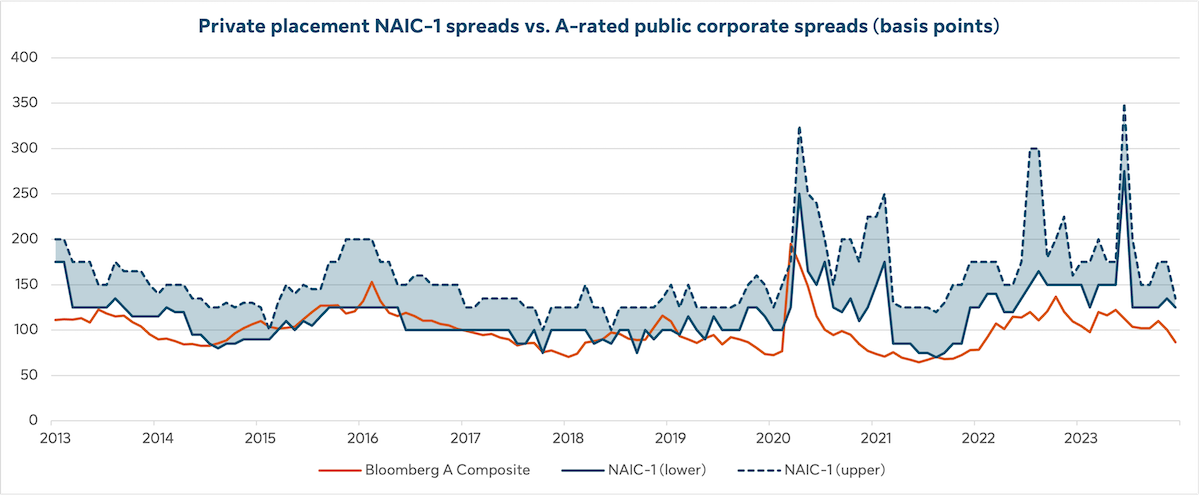
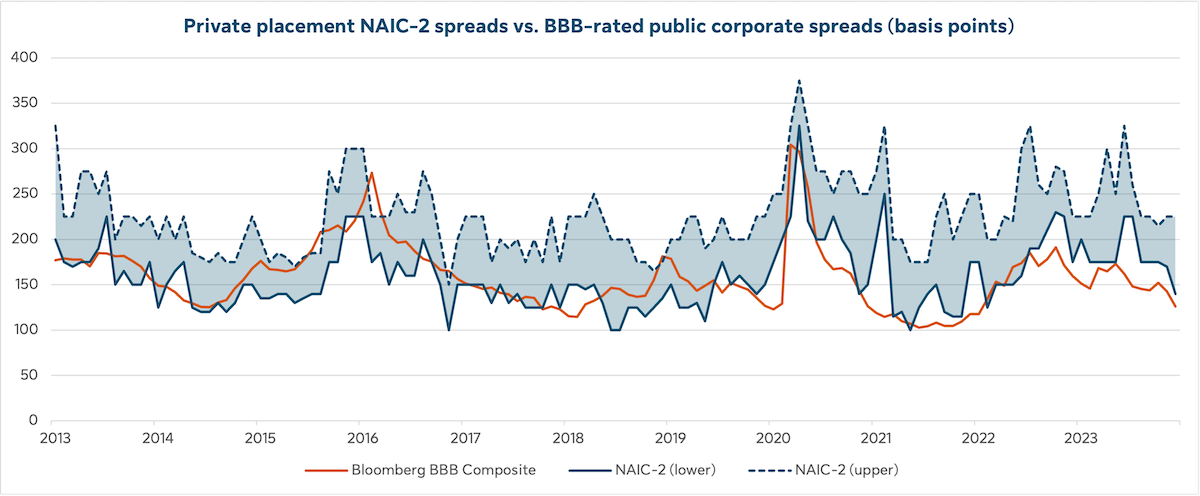
IG private credit historically offers a yield premium over the public market even during times of volatility and economic stress. This yield premium reflects in part the lower liquidity of these investments compared to publicly traded fixed income securities. The availability of external ratings on many of the investments within IG private credit help illustrate this premium. The yield premium underscores that liquidity risk, or the risk that an investment cannot be divested from at any given time, may be more acute in this market.
Higher spreads than public market equivalents
The following exhibits illustrate the differences between private placement market spreads for externally rated transactions with a 10-year average life compared to their corporate bond credit-quality equivalents. We use the spreads of private placements as designated by the National Association of Insurance Commissioners – NAIC-1 for the highest quality and NAIC-2 for high quality – and compare them to composite benchmarks of their recognized equivalents in public corporate markets, of A-rated and BBB-rated corporate spreads, respectively.


Sources: Private Placement Monitor, Bloomberg, 2024. Private placement market spreads were sourced from the Private Placement Monitor using transactions with a 10-year average life. Bloomberg U.S. corporate spreads calculated based on average option-adjusted spreads to Treasury for Bloomberg A Corporate Total Return Index Value Unhedged USD (LCA1TRUU) and Bloomberg Baa Corporate Total Return Index Value Unhedged USD (LCB1TRUU) indexes with an average life of 10.6 years and 10.5 years, respectively. Past performance is not necessarily indicative of future returns. The value of investments and the income derived from investments will fluctuate and can go down as well as up. A loss of principal may occur. It is not possible to directly invest in an index.
Resilience
IG private credit has the ability to perform well in different market cycles, with enhanced yield and capital preservation. This capital preservation is predicated on a combination of covenants and collateral. Private credit covenants help protect investors’ interests in times of market stress by creating timely monitoring and recourse mechanisms. IG private credit borrowers also often pledge collateral as security against the financing which improves recoveries should performance deteriorate. These characteristics have led to fewer defaults and strong recoveries over public bonds, preserving private credit’s relative performance.
Diversification
Within the IG private credit universe, there are a diverse range of issuers, tenors, currencies, structures and collateral that are not always available in public markets. We believe this diversity expands potential investment opportunities and may help balance out overall portfolio performance.
Availability
Finally, even when public markets are volatile or disrupted, private markets typically stay open for business. This market is known to provide certainty of execution and has a history of working with good credits in tough situations, a characteristic that continues to appeal to issuers. The market has seen consistent growth over the decade, including during periods of high volatility and market turmoil.
Trading volumes in U.S. private placement market healthy amid changing market conditions
The following chart illustrates historical U.S. private placement market volumes since 2013.

Source: Private Placement Monitor, as of January 2024. U.S. private placement market volume is defined as the total value of transactions of U.S. bonds not registered for open market public distribution and sold by issuing companies to pre-selected accredited investors, as tracked by Private Placement Monitor in a given year.
Data presented in this article have been calculated internally based on external market data sourced from Private Placement Monitor.
Although most U.S. dollar private placement investments have an external rating, for unrated deals, there is no guarantee that the same rating(s) would be assigned to portfolio asset(s) if they were independently rated by a major credit ratings organization.
The information in this paper is not intended to provide specific financial, tax, investment, insurance, legal or accounting advice and should not be relied upon and does not constitute a specific offer to buy and/or sell securities, insurance or investment services. Investors should consult with their professional advisors before acting upon any information contained in this paper.
SLC Management is the brand name for the institutional asset management business of Sun Life Financial Inc. (“Sun Life”) under which Sun Life Capital Management (U.S.) LLC in the United States, and Sun Life Capital Management (Canada) Inc. in Canada operate. Sun Life Capital Management (Canada) Inc. is a Canadian registered portfolio manager, investment fund manager, exempt market dealer and in Ontario, a commodity trading manager. Sun Life Capital Management (U.S.) LLC is registered with the U.S. Securities and Exchange Commission as an investment adviser and is also a Commodity Trading Advisor and Commodity Pool Operator registered with the Commodity Futures Trading Commission under the Commodity Exchange Act and Members of the National Futures Association. Registration as an investment adviser does not imply any level of skill or training. There is no assurance that the objective of any private placement strategy can be achieved. As with any strategy, the Advisor’s judgments about the relative value of securities selected for the portfolio can prove to be wrong.
The relative value over public benchmarks estimate is derived by comparing each loan’s spread at funding with a corresponding public corporate bond benchmark based on credit rating. Loans that are internally rated as “AA” are compared to the Bloomberg Barclays U.S. Corporate Aa Index, loans rated “A” are compared to the Bloomberg Barclays U.S. Corporate A Index, while loans rated “BBB” are compared to the Bloomberg Barclays U.S. Corporate Baa Index. For certain power and utility project loans, a best fit approach of a variety of Bloomberg Barclays’ indices was employed prior to September 30, 2016. After this date, these types of loans were compared to Bloomberg Barclays Utilities A Index and Bloomberg Barclays Utilities Baa Index, for “A” and “BBB” internally rated loans, respectively. Relative spread values obtained through the above methodologies were then aggregated and asset weighted (by year) to obtain the overall spread value indicated in the paper.
Unless otherwise stated, all figures and estimates provided have been sourced internally and are as of December 31, 2023. Unless otherwise noted, all references to “$” are in U.S dollars. Past performance is not indicative of future results.
Investments involve risk, including loss of principal. Diversification does not guarantee against loss or ensure a profit. Nothing herein constitutes an offer to sell or the solicitation of an offer to buy securities. The information in these materials is provided solely as reference material with respect to the Firm, its people and advisory services business, as an asset management company.
Market data and information included herein is based on various published and unpublished sources considered to be reliable but has not been independently verified and there is no guarantee of its accuracy or completeness.
This content may present materials or statements which reflect expectations or forecasts of future events. Such forward-looking statements are speculative in nature and may be subject to risks, uncertainties and assumptions and actual results which could differ significantly from the statements. As such, do not place undue reliance upon such forward-looking statements. All opinions and commentary are subject to change without notice and are provided in good faith without legal responsibility. Unless otherwise stated, all figures and estimates provided have been sourced internally and are current as at the date of the paper unless separately stated. All data is subject to change.
No part of this material may, without SLC Management’s prior written consent, be (i) copied, photocopied or duplicated in any form, by any means, or (ii) distributed to any person that is not an employee, officer, director, or authorized agent of the recipient.
© 2024, SLC Management
SLC-20240201-3346802


